I’ve installed a stack beacon in my homelab
June 16, 2025
My homelab is fully monitored using Prometheus and Grafana, which already gives me a solid overview of system health and performance. But one day I thought: “Wouldn’t it be cool to add something more interesting to this setup?”
That’s when I decided to integrate a stack / andon beacon. The kind you typically see on industrial machines. These beacons provide instant visual feedback using different lights. I figured this would be a nice way of quickly seeing the health of my infrastructure at a glance.
In this article I’ll explain how I built this project, covering everything from the hardware components to the control software and configuration. I genuinely enjoyed working on it and I’m really happy with how it turned out. Hopefully, that enthusiasm comes through as you read, and maybe it will inspire you to build something similar for your own homelab.
Finding components and developing the circuit
I was confident this project would work from the software side, so the first step was gathering the hardware. I won’t link specific parts, but here’s a list of what I used:
- A stack beacon (I picked a cheap one from AliExpress)
- An ESP32 development board
- A buck converter to step up the USB voltage
- PNP and NPN transistors, resistors, and a stripboard
- A junction box and screws to mount everything
- An old USB cable for power
In this case controlling the beacon isn’t as simple as wiring the lights to GPIO pins. The model I chose runs at 12V and uses a common ground, which complicates things slightly. To control each light individually, I had to build a basic circuit using NPN and PNP transistors.
I enjoy tinkering with electronics, though I’m far from an expert, so don’t take this as an electrical tutorial! That said, here’s the schematic I came up with:

Once the schematic was ready, I tested a simplified version on a protoboard to confirm everything worked before moving to the final assembly.

Final assembly
With the test version working, I moved on to building the final one. I soldered all the components onto a stripboard. This part was a bit challenging for me since I don’t have much soldering experience, but I managed to get it done. In the end, it worked as expected and didn’t look too bad either.

Once the control board was complete, I started mounting everything inside the junction box. I attached the beacon to the lid and soldered its wires directly to the control circuit. For power, I used a USB cable connected to a buck converter:
- The 5V input of the buck converter was also used to power the ESP32 using jumper cables.
- The 12V output of the converter went into the control circuit to power the beacon lights.
Then, I connected three GPIO pins from the ESP32 to the control board, one for each color. This setup allows the ESP32 to control the lights individually.

I’m happy with how it turned out. It may not be a commercial-grade build, but it’s functional and sturdy.
I considered designing and printing a custom enclosure for a cleaner finish, but given the size and weight of the beacon, I was concerned about stability. The junction box ended up working fine, it also adds that industrial look to it.
Software : Webhook to MQTT forwarder
Now let’s talk about the software side of the project. My goal was to forward alerts from Prometheus Alertmanager to the ESP32 using MQTT. The problem is that Alertmanager doesn’t support MQTT out of the box. There are several ways to bridge this gap:
- Use Grafana’s alerting system, which supports MQTT
- Run an HTTP server on the ESP32 and send alerts directly
- Use a custom webhook handler to convert alerts to MQTT
I decided to go with the last option. I wanted to build something more flexible and also take the opportunity to develop a small tool of my own.
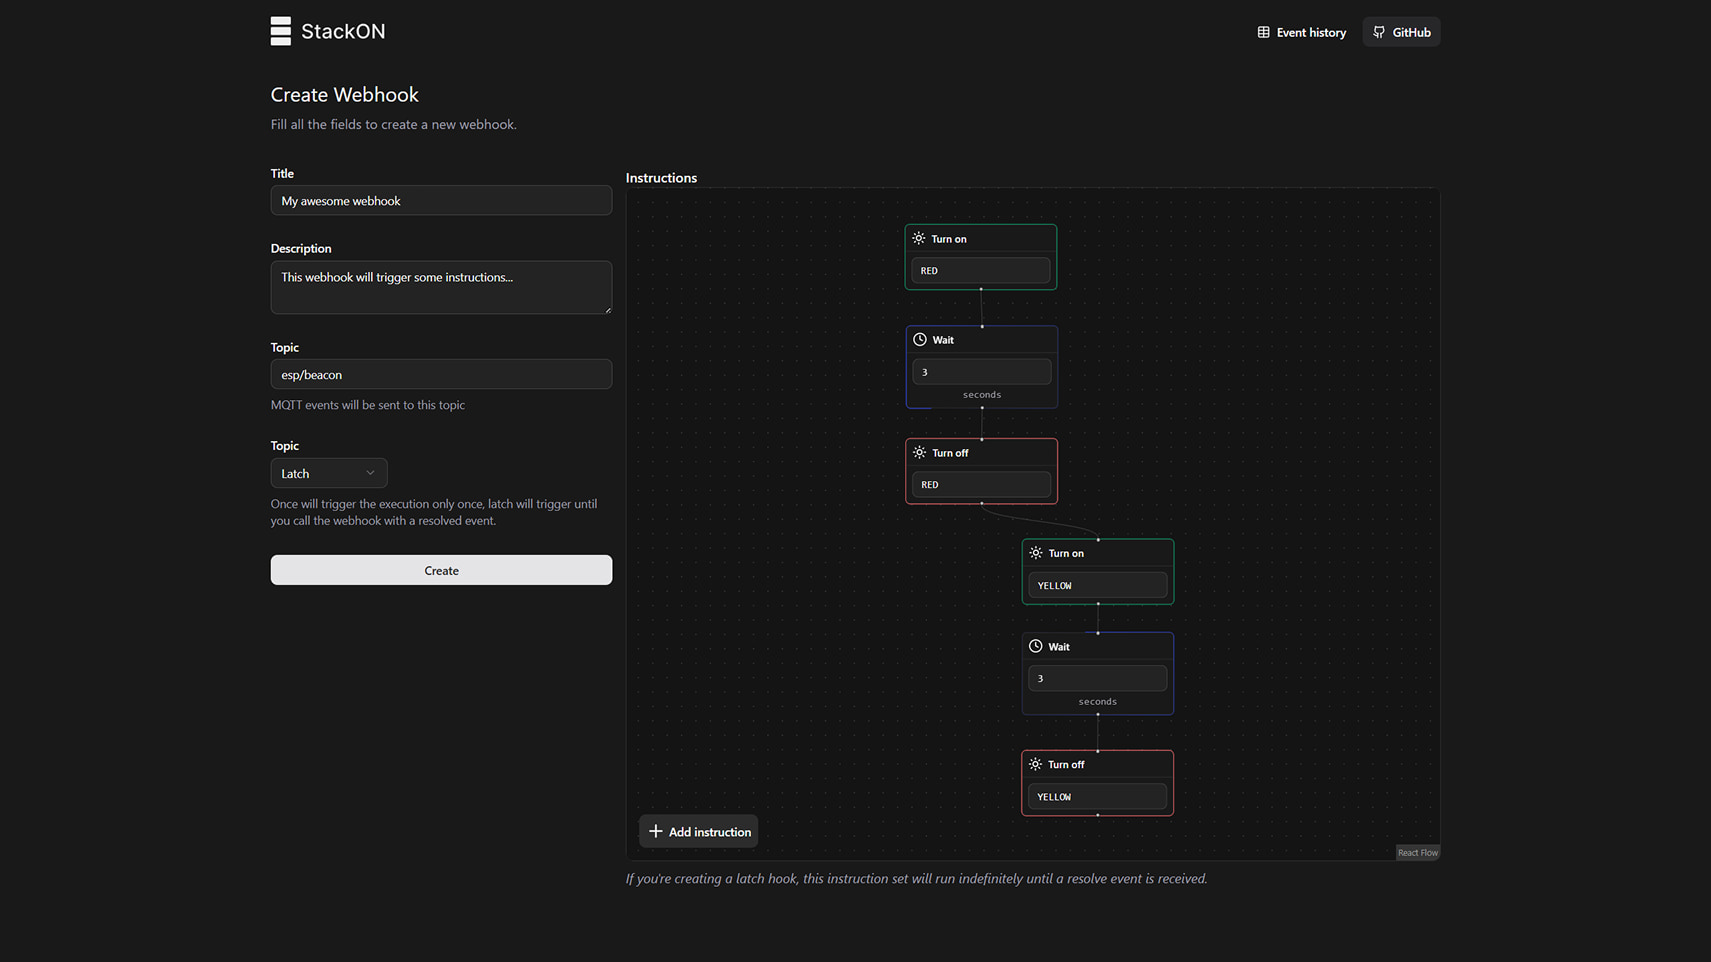
I created and open sourced a tool called StackON, it basically allows you to create different webhooks that accept alertmanager payloads. You can attach a series of simple instructions to these webhooks, for example: turn on red, wait 10, turn off red. When you call the webhook the system will forward a MQTT event to the specified topic including some alert info and the instructions.
The idea is that you can create different custom light sequences for each webhook without needing to reprogram the ESP32 client. With my alertmanager configuration each webhook is called for a different severity. I have different webhooks for each severity, for example the warning webhook will run an amber light sequence.
I hope you get my point, yes this is overcomplicating the development and setup of the system. But in the other hand you will get nicer operation experience.
If you want to recreate the project or do a similar thing, feel free to take a look at StackON source code. You should be able to have it running in less than 5 minutes with the prebuilt docker image.
Software: the ESP32 beacon client
To complete the system, I also developed a small client that runs on the ESP32. Its job is to subscribe to a specific MQTT topic and listen for incoming messages sent by StackON. Each payload contains a set of simple instructions, which the client parses and executes to control the beacon lights.
This client is meant to be a simple example rather than a polished solution. If you plan to recreate this project or adapt it to your own use case, I recommend writing a client that fits your specific hardware and logic. Mine works well enough for my setup, but there’s definitely room for improvement.
Final result
In the end, the project works just as I hoped. The beacon now lights up based on alerts sent by Alertmanager, making it easy to get a quick visual status of my homelab at a glance.

Is it the best monitoring solution out there? Definitely not. It’s not meant to replace detailed dashboards or logs. But it is a fun and useful addition to the overall setup. A stack beacon like this gives you an immediate signal that something’s wrong.
In my homelab, I now use the beacon alongside Grafana to get a high-level overview and to highlight specific custom alerts in a more visual, geeky way.